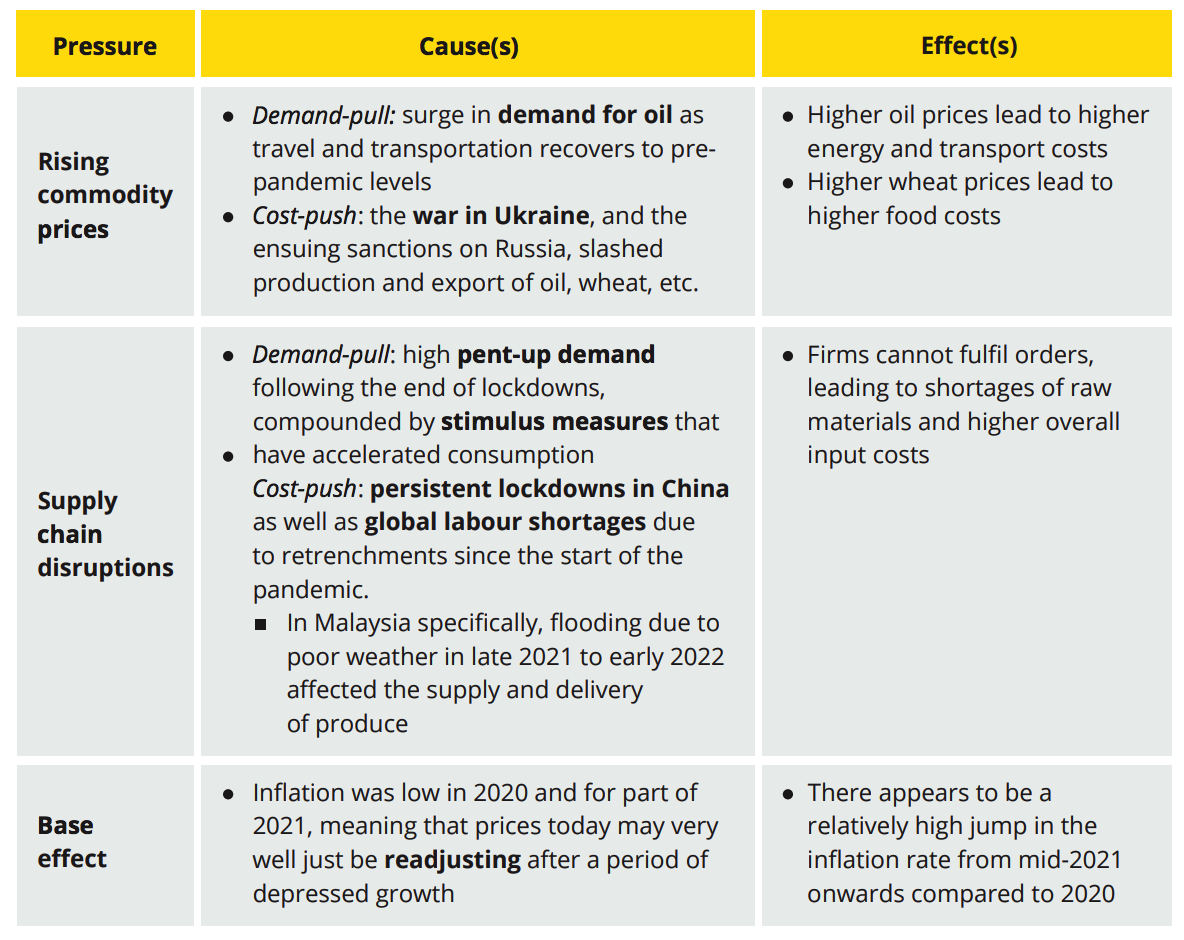
The origins of inflation can usually be boiled down to two key factors:
(i) Demand-pull inflation: when overall demand for goods in an economy outpaces the market’s ability to supply the goods, there is upward pressure on prices. It can be caused by a shock in the economy or through stimulus measures.
(ii) Cost-push inflation: when production costs rise due to growing input costs, more expensive imports or higher wages, producers raise prices charged to consumers to maintain profitability. Input costs in turn can rise due to supply-side shortages caused by geopolitical, meteorological or manpower issues.
Major global inflationary pressures today:
Methodology:
The Consumer Price Index (CPI) is the main measure of inflation, which tracks overall changes in the average prices of a defined ‘basket of goods’ over time.
In Malaysia, the calculation of the CPI produces a final figure called headline inflation, which represents the rate of inflation for a given month compared to the same month a year earlier. For example, Malaysia’s headline inflation rate in May 2022 was 2.8%, meaning the CPI increased by 2.8% that month compared to May 2021
To obtain the CPI, we take the average of the prices for all categories weighted by their
relative importance in the consumer basket.
Explaining the mismatch between CPI and consumer sentiments:
Since the start of 2022, inflation in Malaysia seems to have stabilised in the 2-3% range. But how far is this reflective of the situation on the ground?
To answer this question, it is important to think critically about the CPI and its methodology.
There are 4 points we should take note of here:
(i) Inflations, not inflation
Inflation affects different groups of people differently depending on income level, place of residence, age and other factors. While the official headline inflation figure is 2.8%, it does not mean that all households will experience a similar increase in their cost of living.
For example, low-income households are more likely to spend a disproportionate share of their earnings on day-to-day products like food and transport – whose prices tend to fluctuate more in response to global conditions – than on less price-sensitive, long-term services like education and leisure.
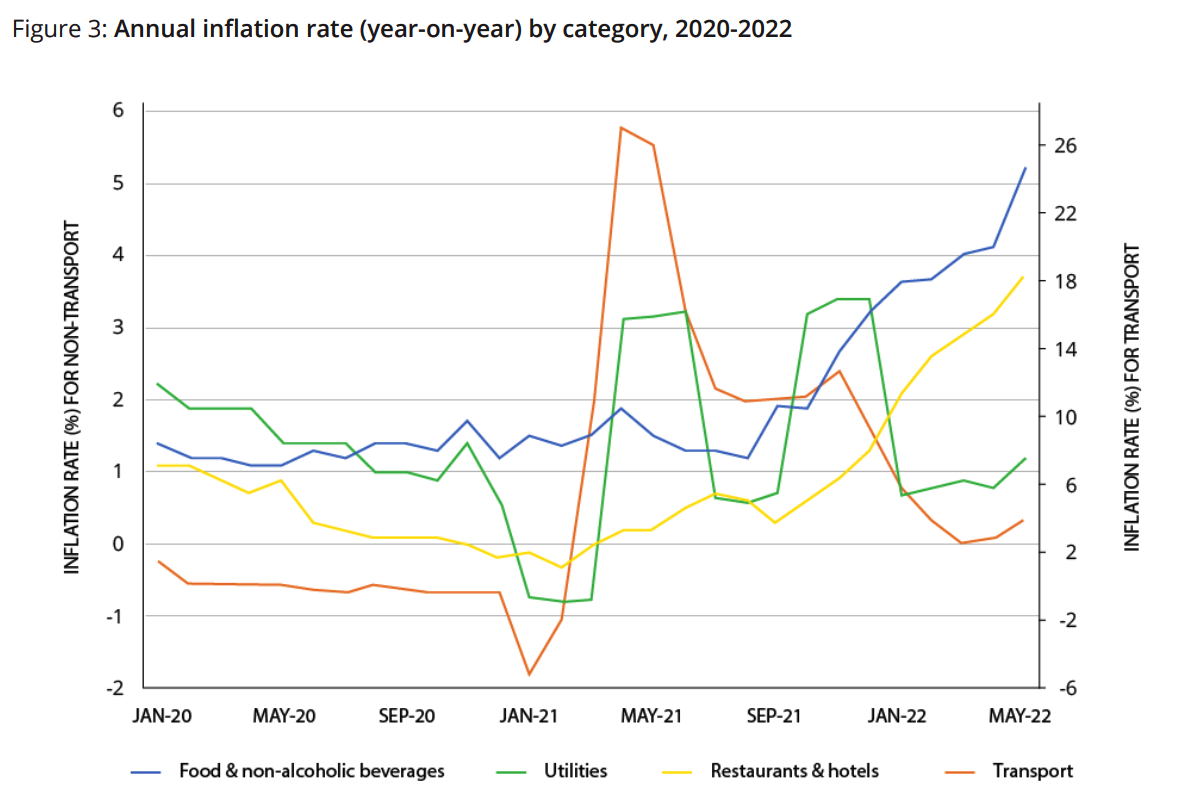
In fact, when we break down the components of CPI, we find that the price of food and
non-alcoholic beverages rose the most of any category at 5.2% year-on-year in May 2022 (see Figure 3), the highest such increase since 2017.
(ii) Read the fine print: some prices rise more than others
As previously mentioned, the CPI category with the largest price increase is ‘food and non-alcoholic beverages’. But even this does not fully capture the heterogeneity of price behaviour across food products.
According to DOSM data, the 5.2% price growth in food overall is regulated by the relatively stable prices of rice, fish and fruits among others, which collectively make up nearly a third of the food bundle. On the contrary, meat, dairy products and vegetables reported price growth of at least 8% in May 2022. These three sub-categories are assigned a lower weightage of just over 20% of total food purchases.
(iii) Price increases alone do not capture the full extent of cost-of-living concerns
Another drawback of the CPI is that it cannot account for non-price related components of inflation, such as shrinkflation. Shrinkflation is a situation where, in response to rising costs, a producer sells a smaller amount of a product at a similar price. The CPI would understate the true rise in cost in this case.
Yet another invisible risk at play is the significant upward pressure on cost of production. The cost of production is captured in the Producer Price Index (PPI), and it shows much larger rises than the CPI over comparable periods, in particular for “Agriculture, forestry and fishing”, which have surged by almost 18% in 2022 alone.
(iv) Cognitive biases: are prices really going up that much?
It is also worth noting that households may be subject to certain cognitive biases that heighten their perception of inflation, including:
But maintaining a currency peg is not a straightforward exercise: the government has to constantly defend the currency against speculation using its reserves of foreign currency.
REFSA Notes is a collection of thoughts, reflections, and ideas from our research team. They aim to provide the groundwork for further discussions, commentary, research agendas, and policy recommendations.

REFSA Notes #7/2022: Deconstructing Economic Indicators: Inflation
By Jaideep Singh
READ FULL REPORT HERE
VIEW INFOGRAPHICS HERE
Causes of inflation:
The origins of inflation can usually be boiled down to two key factors:
(i) Demand-pull inflation: when overall demand for goods in an economy outpaces the market’s ability to supply the goods, there is upward pressure on prices. It can be caused by a shock in the economy or through stimulus measures.
(ii) Cost-push inflation: when production costs rise due to growing input costs, more expensive imports or higher wages, producers raise prices charged to consumers to maintain profitability. Input costs in turn can rise due to supply-side shortages caused by geopolitical, meteorological or manpower issues.
Major global inflationary pressures today:
Methodology:
The Consumer Price Index (CPI) is the main measure of inflation, which tracks overall changes in the average prices of a defined ‘basket of goods’ over time.
In Malaysia, the calculation of the CPI produces a final figure called headline inflation, which represents the rate of inflation for a given month compared to the same month a year earlier. For example, Malaysia’s headline inflation rate in May 2022 was 2.8%, meaning the CPI increased by 2.8% that month compared to May 2021
To obtain the CPI, we take the average of the prices for all categories weighted by their
relative importance in the consumer basket.
Explaining the mismatch between CPI and consumer sentiments:
Since the start of 2022, inflation in Malaysia seems to have stabilised in the 2-3% range. But how far is this reflective of the situation on the ground?
To answer this question, it is important to think critically about the CPI and its methodology.
There are 4 points we should take note of here:
(i) Inflations, not inflation
Inflation affects different groups of people differently depending on income level, place of residence, age and other factors. While the official headline inflation figure is 2.8%, it does not mean that all households will experience a similar increase in their cost of living.
For example, low-income households are more likely to spend a disproportionate share of their earnings on day-to-day products like food and transport – whose prices tend to fluctuate more in response to global conditions – than on less price-sensitive, long-term services like education and leisure.
In fact, when we break down the components of CPI, we find that the price of food and
non-alcoholic beverages rose the most of any category at 5.2% year-on-year in May 2022 (see Figure 3), the highest such increase since 2017.
(ii) Read the fine print: some prices rise more than others
As previously mentioned, the CPI category with the largest price increase is ‘food and non-alcoholic beverages’. But even this does not fully capture the heterogeneity of price behaviour across food products.
According to DOSM data, the 5.2% price growth in food overall is regulated by the relatively stable prices of rice, fish and fruits among others, which collectively make up nearly a third of the food bundle. On the contrary, meat, dairy products and vegetables reported price growth of at least 8% in May 2022. These three sub-categories are assigned a lower weightage of just over 20% of total food purchases.
(iii) Price increases alone do not capture the full extent of cost-of-living concerns
Another drawback of the CPI is that it cannot account for non-price related components of inflation, such as shrinkflation. Shrinkflation is a situation where, in response to rising costs, a producer sells a smaller amount of a product at a similar price. The CPI would understate the true rise in cost in this case.
Yet another invisible risk at play is the significant upward pressure on cost of production. The cost of production is captured in the Producer Price Index (PPI), and it shows much larger rises than the CPI over comparable periods, in particular for “Agriculture, forestry and fishing”, which have surged by almost 18% in 2022 alone.
(iv) Cognitive biases: are prices really going up that much?
It is also worth noting that households may be subject to certain cognitive biases that heighten their perception of inflation, including:
Policy measures to address inflation
1. Monetary policy
–
If a central bank believes that the economy is likely to become overheated due to rising price pressures, it will respond by raising interest rates. As the interest rate is essentially the cost of borrowing money, a higher rate makes it relatively more expensive to take out a loan (and also more attractive to save rather than spend). This has the effect of reducing the incentive to invest and spend, which can slow down demand-pull inflation in the economy.
–
2. Fiscal policy
Under fiscal policy, the government can implement contractionary measures like raising taxes to dampen consumption and therefore reduce demand-pull inflationary pressures in the economy. However, unlike monetary policy, there is a time lag with fiscal policy: the effects on output and prices are not immediate
–
3. Price ceiling
A price ceiling is a policy in which the government sets a legal maximum price for a good. This is intended to maintain the affordability of the good by controlling its retail price.
But a price ceiling has unintended consequences that can distort the market if misused. If the ceiling price is found to be below what would prevail in the absence of such regulation based on input costs, we could expect to see a shortage of the good. This is because an artificially low price pushes demand above producers’ capacity to supply.
–
4. Subsidy
A subsidy is an incentive, such as a cash payment or a tax break, given to producers to lower the price that the end consumer would pay for welfare purposes.
Typically, how this works is that the government gives some form of support to the producer. The cost of production goes down, which encourages firms to increase supply. In turn, higher supply at a given level of demand pushes prices down. The end result, in theoretical terms, is that the consumer benefits from lower prices at the point of purchase while the producer benefits from the lower cost at the point of production.
However, for this to happen, the government needs to pay for the subsidy. This can put pressure on the budget, and by extension, on taxpayers if the cost of maintaining the subsidy balloons.
–
5. Currency peg
A currency peg is a fixed exchange rate system in which the government decides to intervene in the market to maintain the value of its currency relative to the US dollar.
In theory, this might seem like a desirable policy objective for a government that wants to reduce the risk of imported inflation.
READ FULL REPORT HERE
VIEW INFOGRAPHICS HERE
–
RESEARCH
PILLARS
RESEARCH
CATEGORIES